Monitoring
Monitoring is where you find out what is wrong, what is normal, and what to report. Its tabs are Alerts, Events, Diagnostics, Metrics, and Reports. The red badge next to Monitoring in the left menu counts active alerts.
Alerts
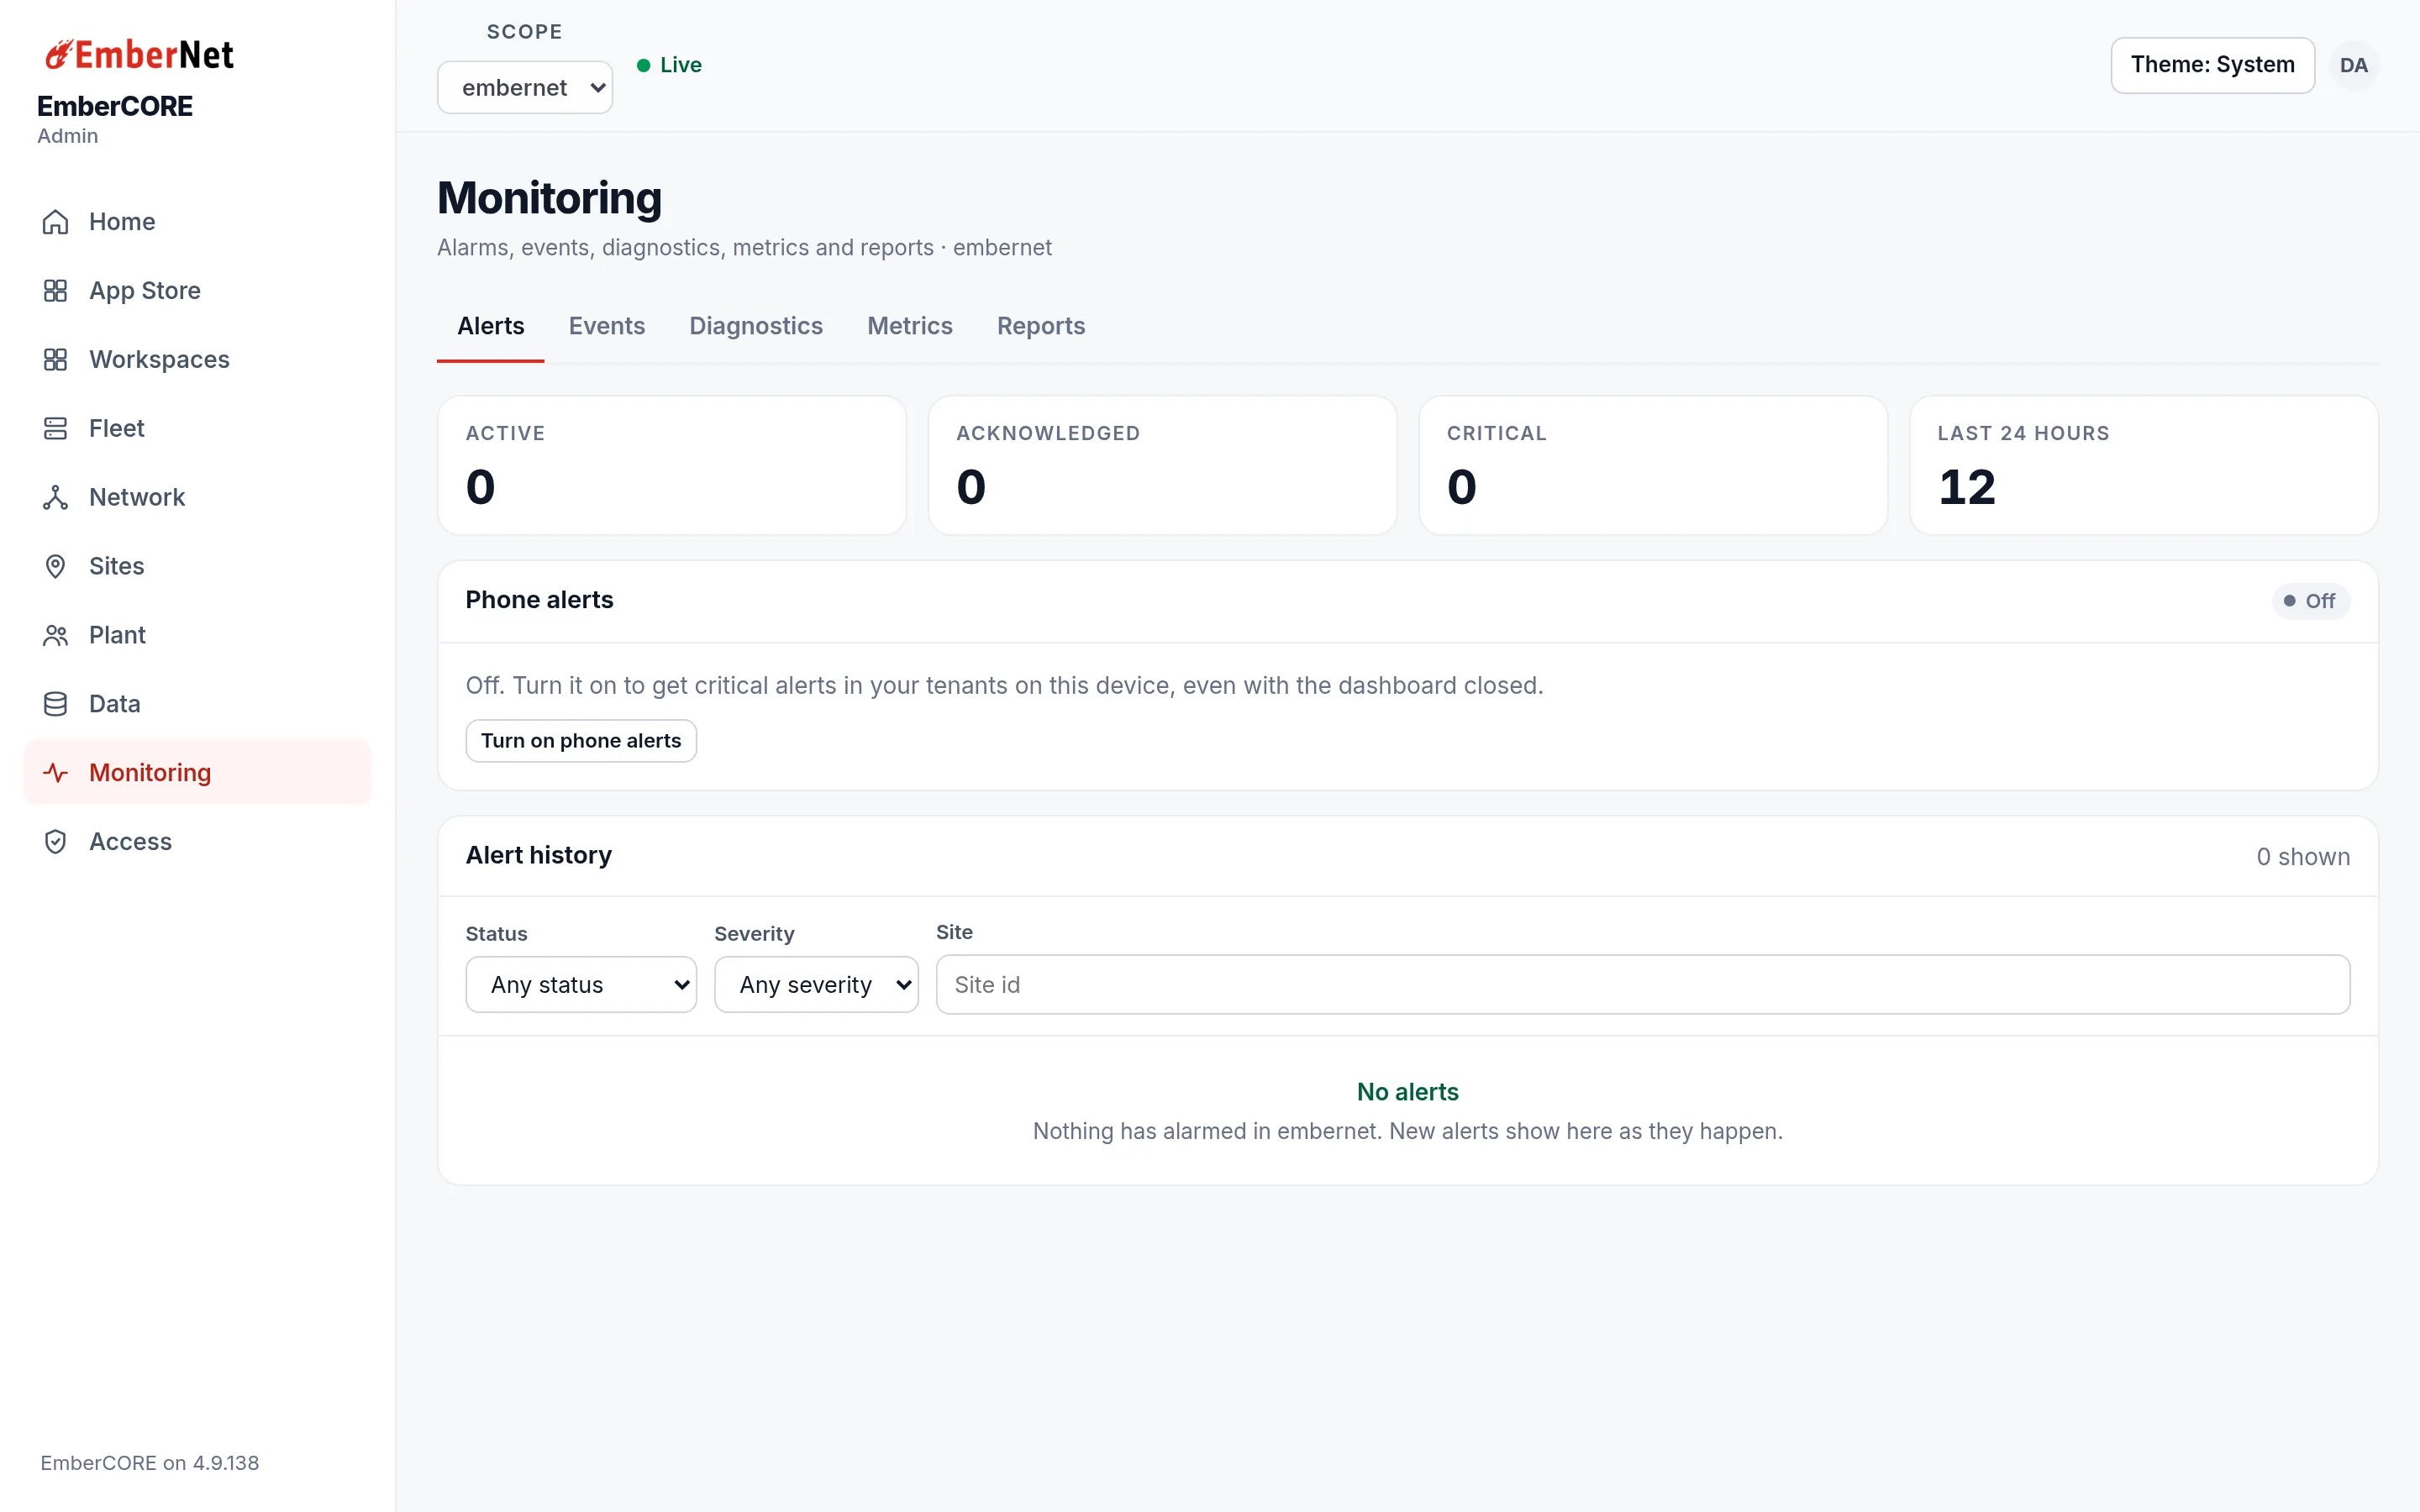
The counters show Active, Acknowledged, Critical, and Last 24 hours. Phone alerts lets you turn on push notifications on the device you are using, so a critical alert reaches you even with the console closed. The Alert history table lists each alert with its severity, what happened, the device, the site, the tenant, its status, and when it was raised. Filter it by status, severity, or site.
A resolved alert stays in the history, so you can see that a problem happened and when it cleared. The conditions that raise alerts, and where notifications go, are on the Alerts & Notifications page.
Events
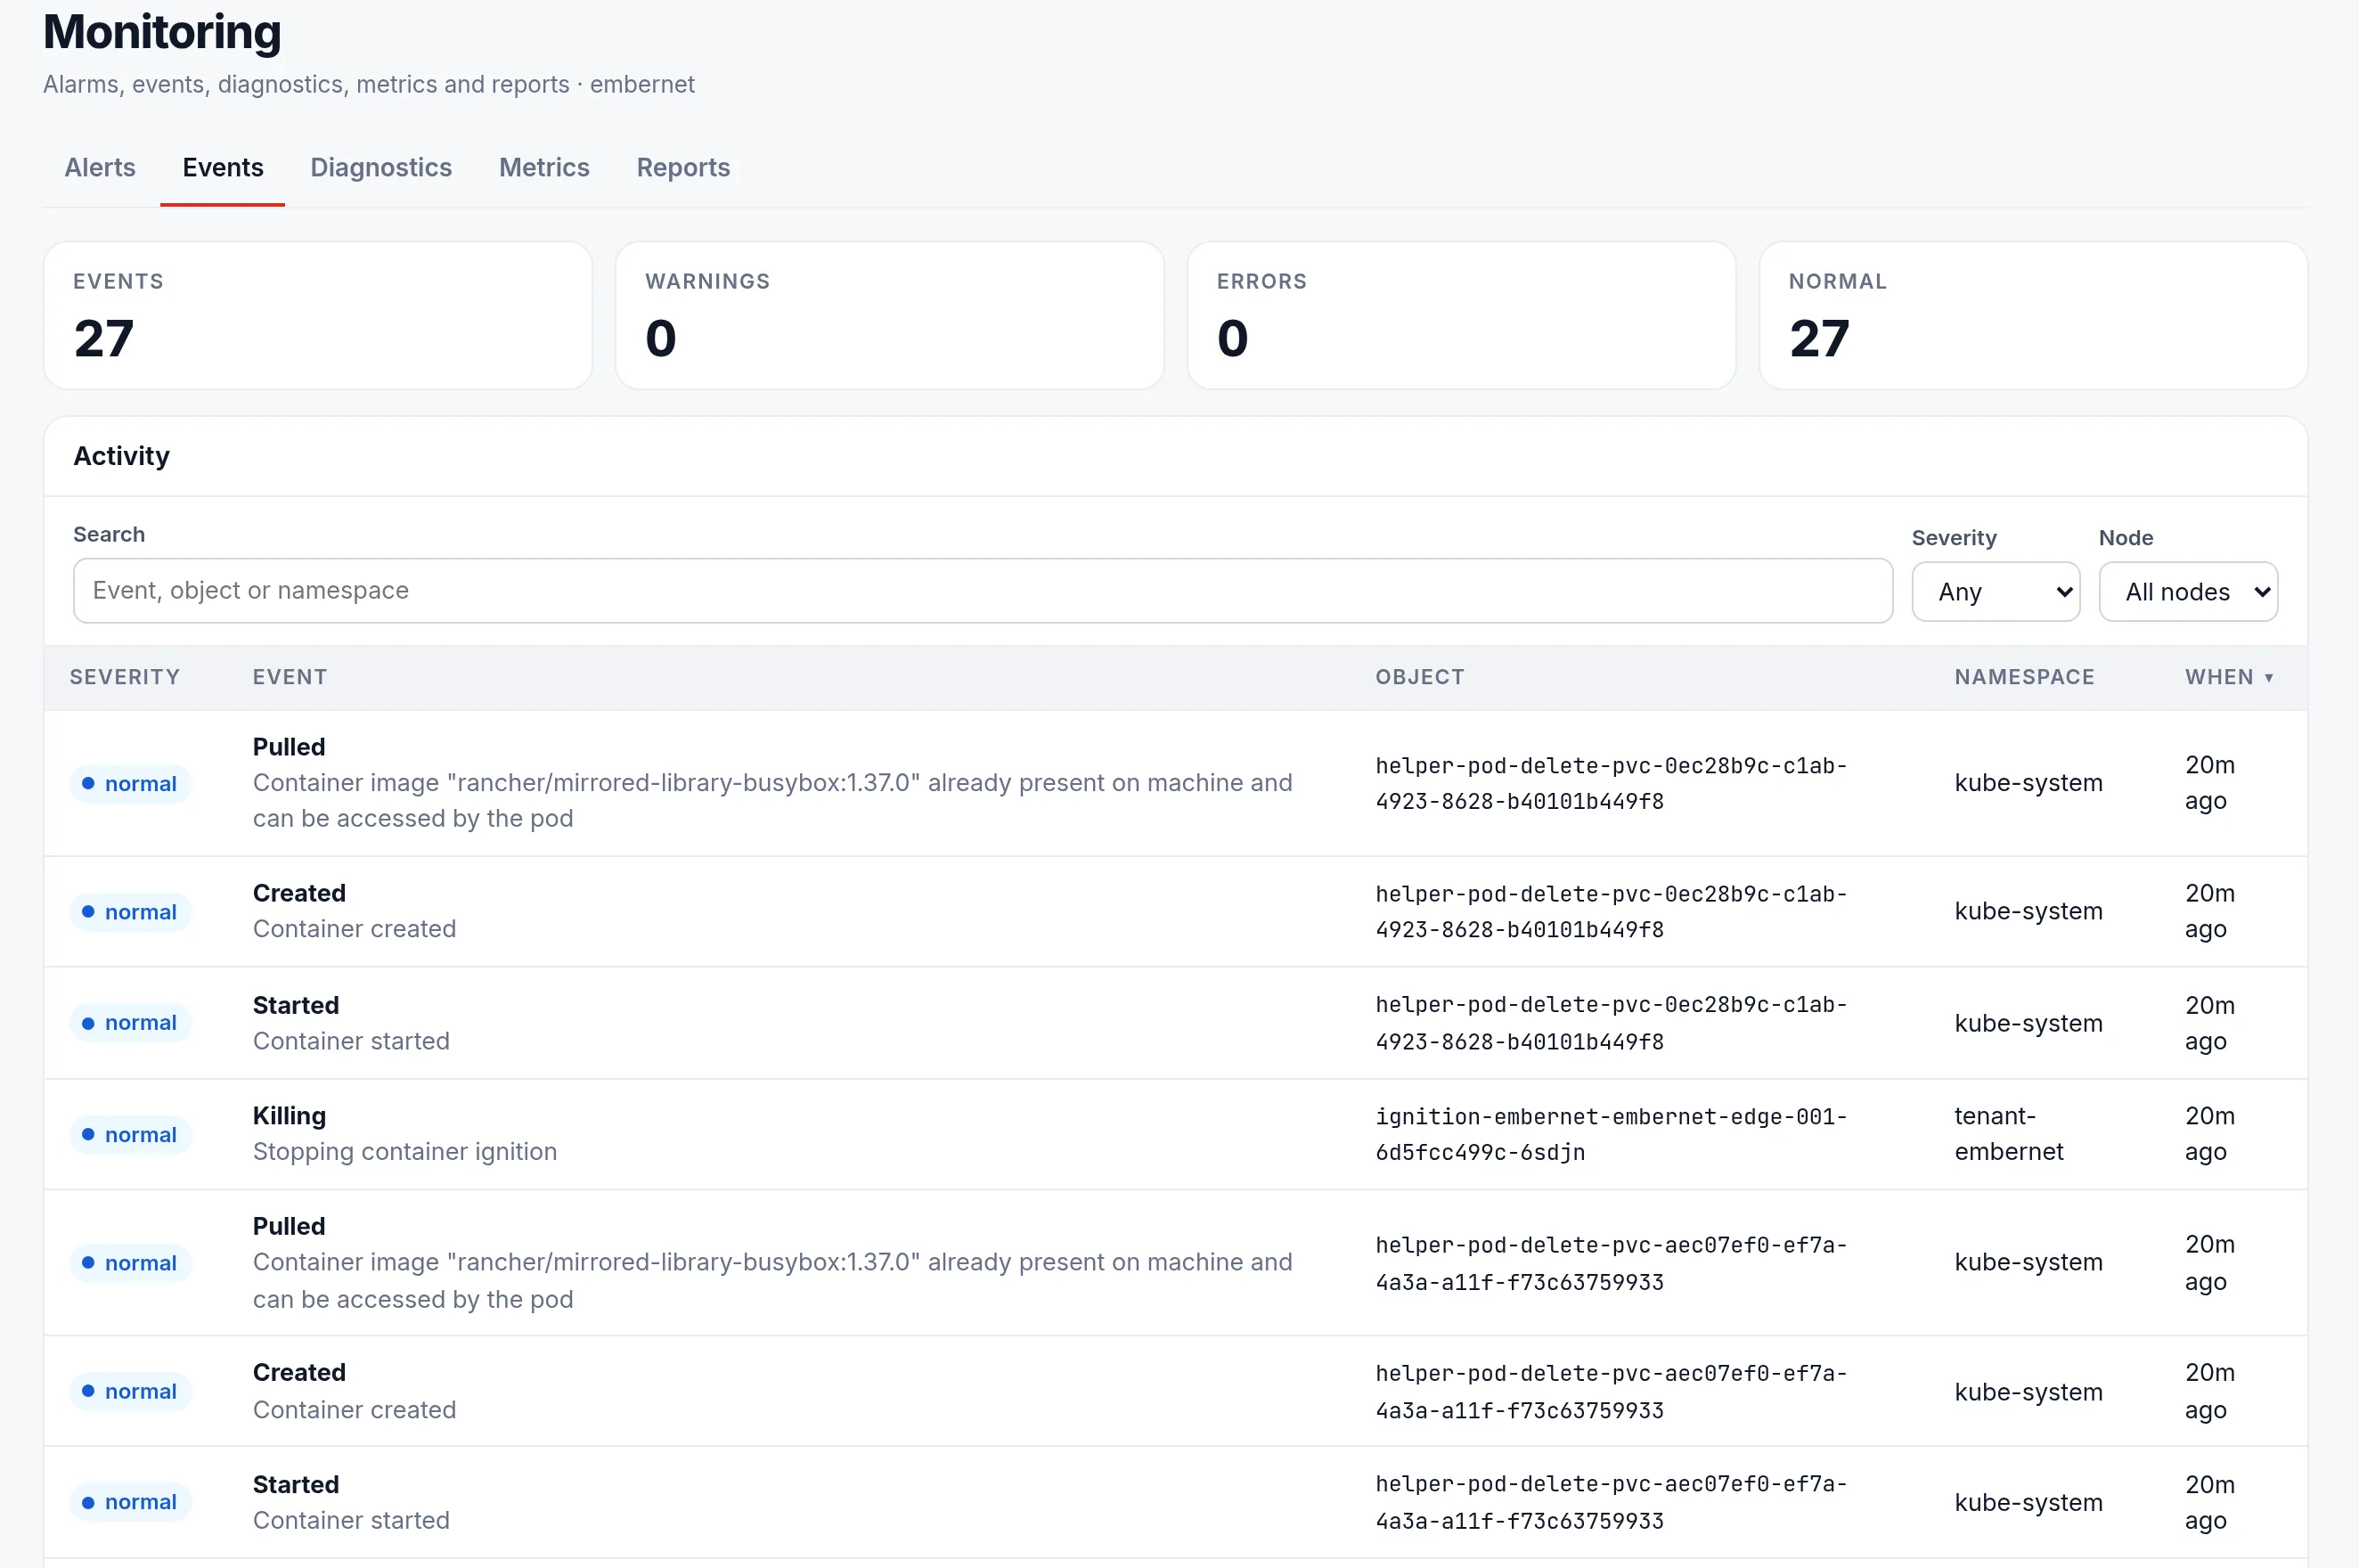
Events shows the activity stream from your clusters. Counters read Events, Warnings, Errors, and Normal, and the list can be searched and filtered by severity and node. An empty list means the cluster has nothing to report in its retention window.
Diagnostics
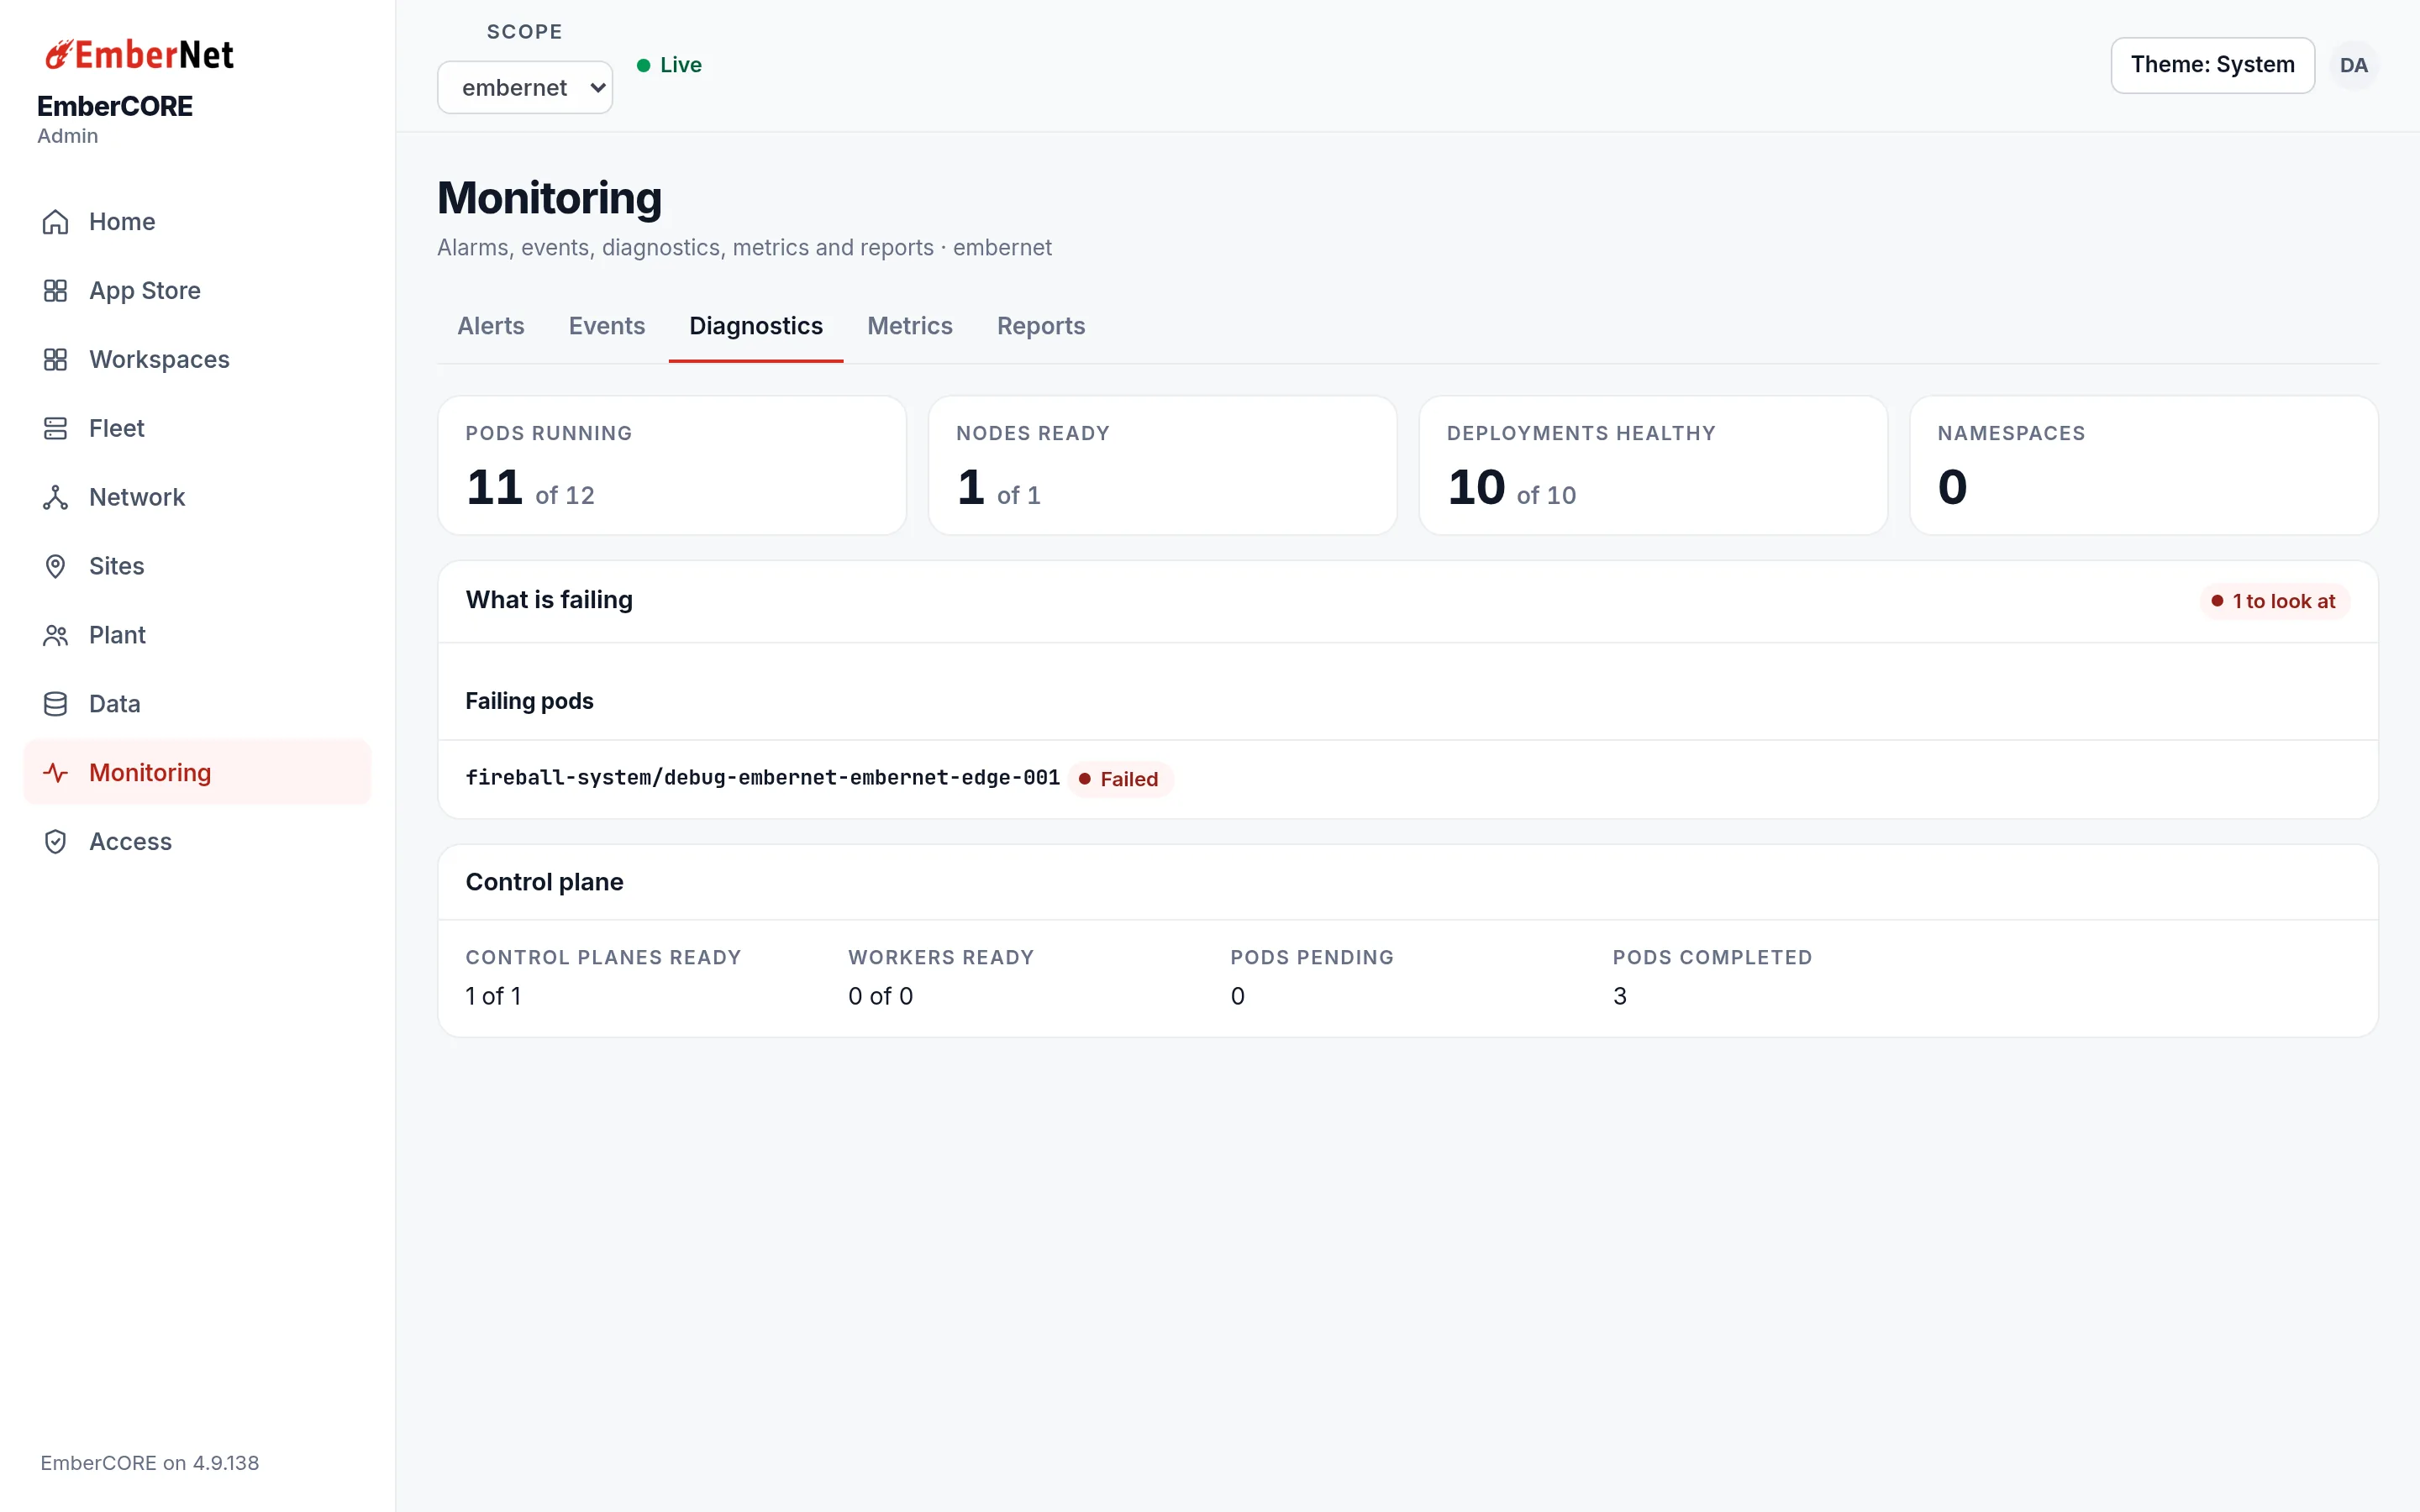
Diagnostics answers one question: is anything failing right now. The counters cover Pods running, Nodes ready, Deployments healthy, and Namespaces. What is failing lists the pods or nodes that are not healthy, and says "Nothing is failing" when everything is up. Control plane reports how many control plane and worker nodes are ready.
Metrics
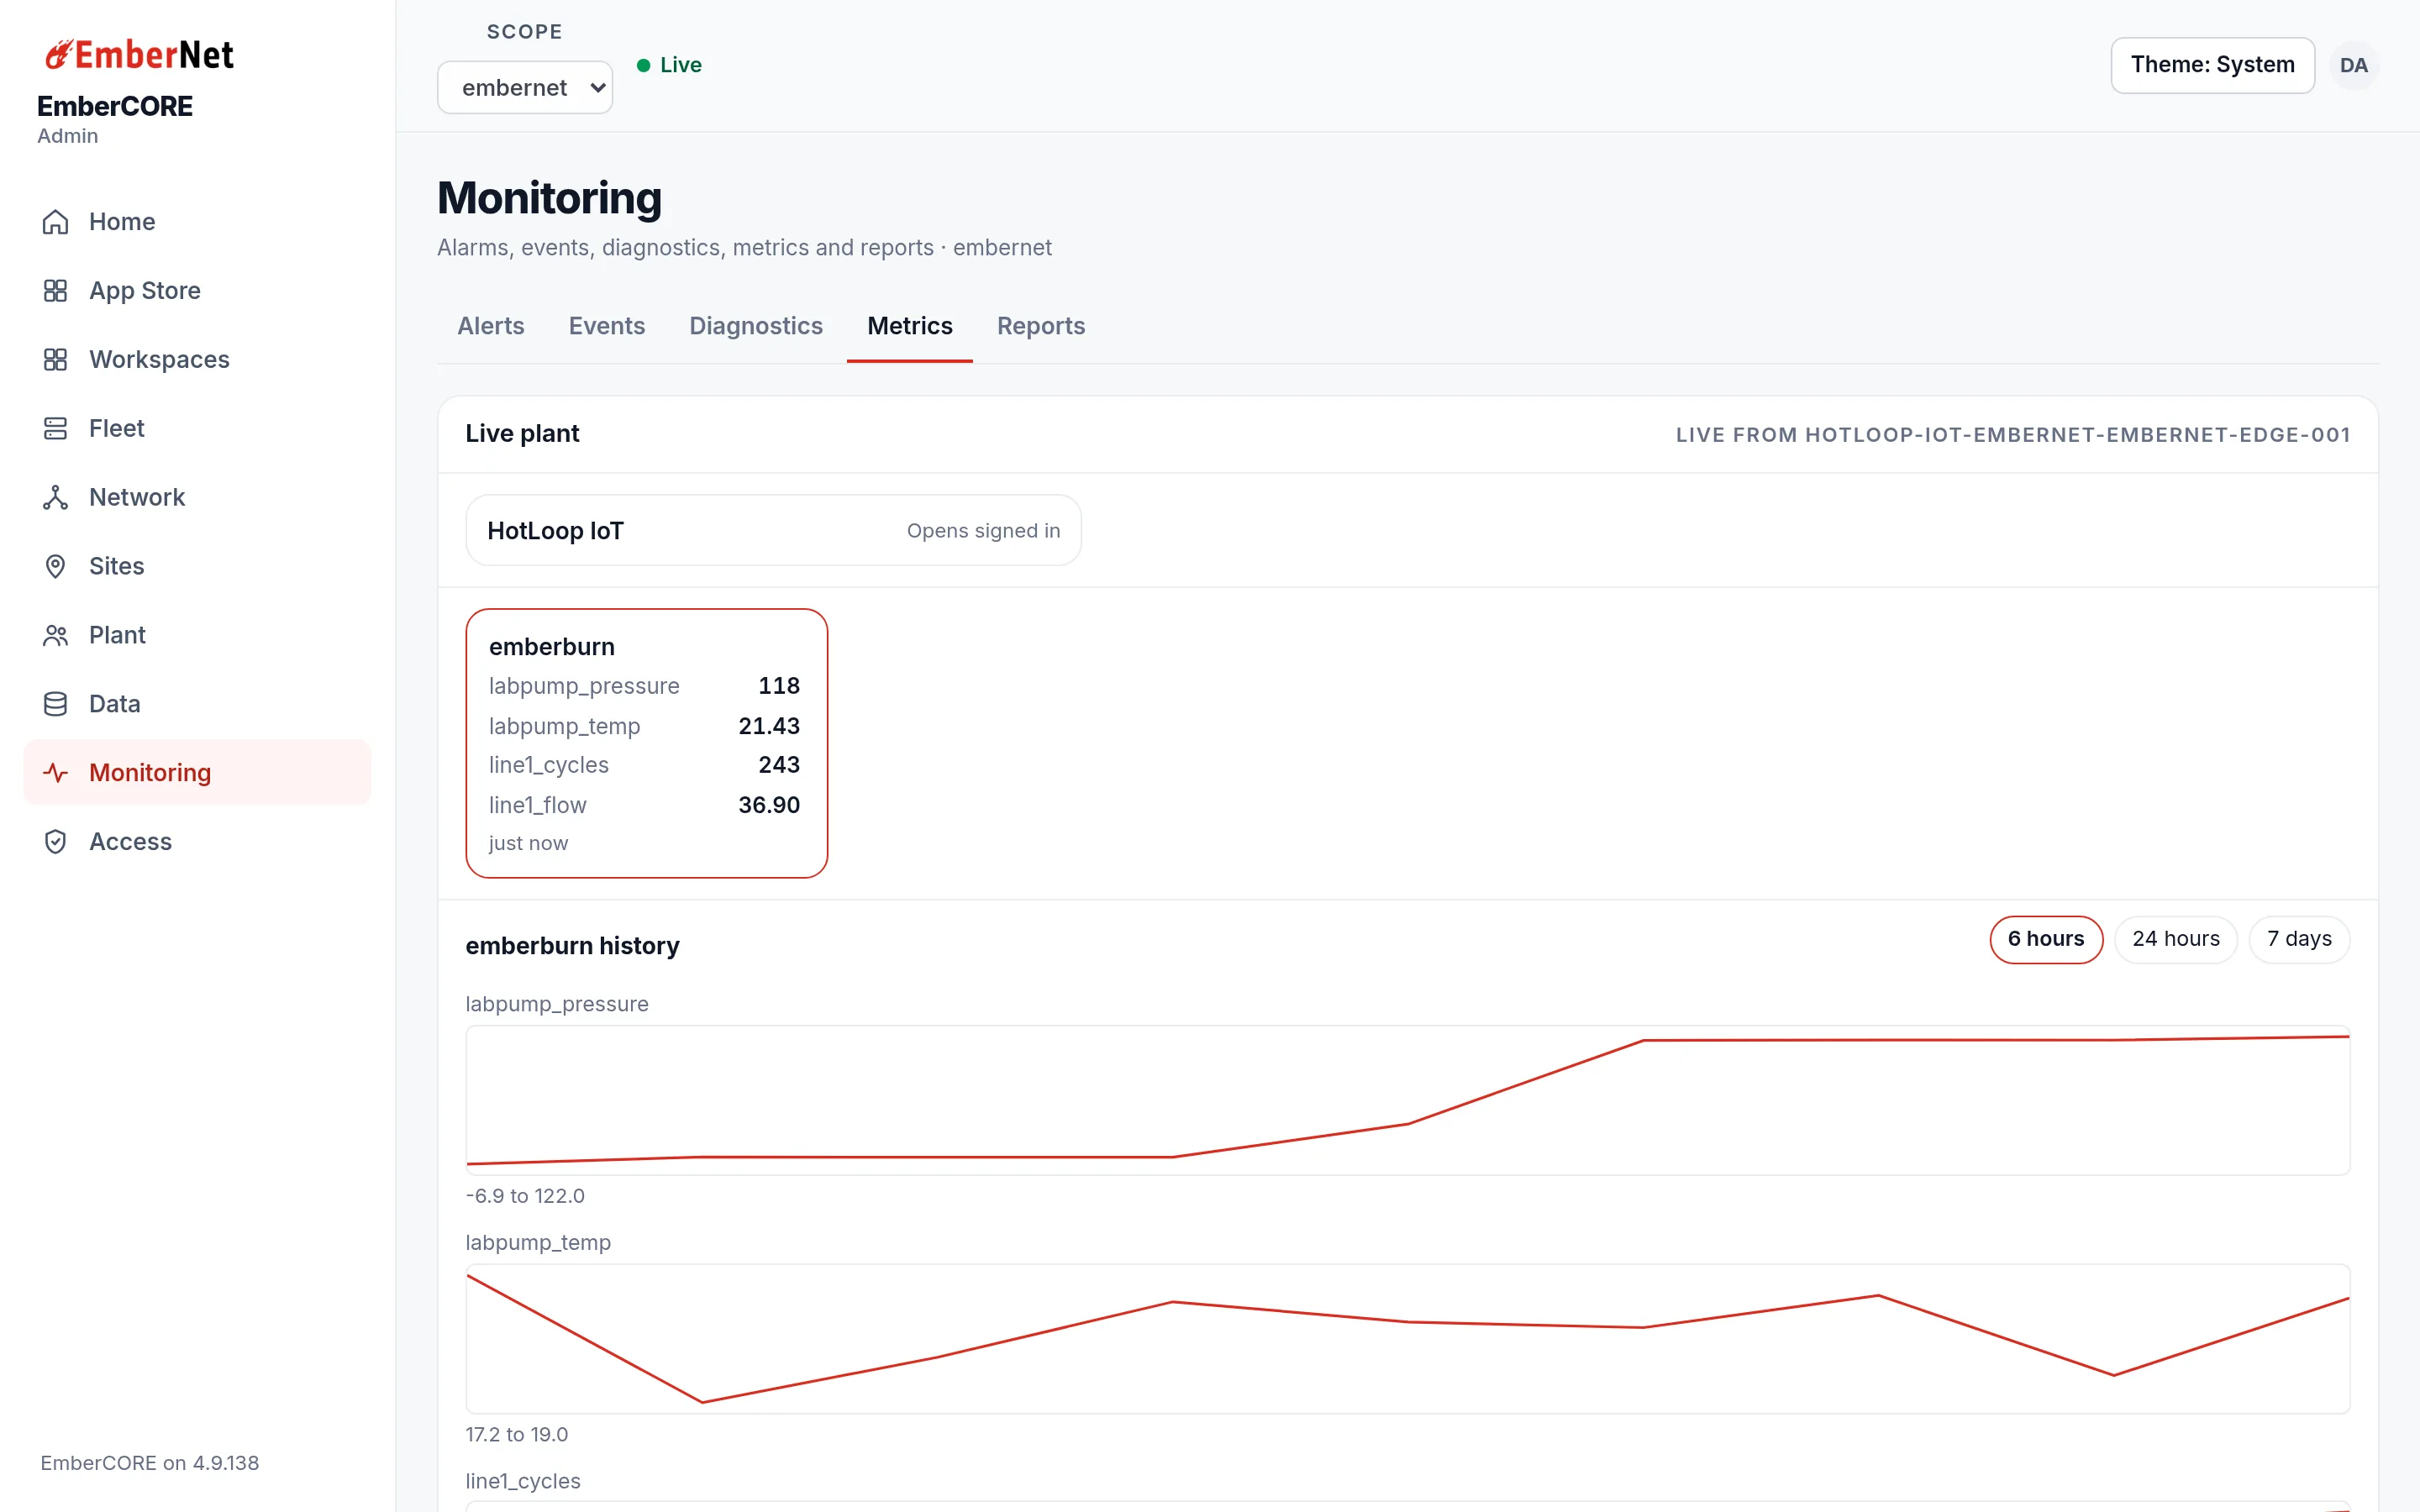
Metrics shows live cards grouped by category. Pick a chip (Overview, Network, Industrial, Deploy, Infrastructure, Devices, Monitoring, Sites, Compliance, or Platform) and the cards change to match. Under each card is a selector for how it is drawn, such as a meter, a split, or a trend, and Choose cards lets you pick which cards appear. The Metrics & Monitoring page explains what each number means.
Reports
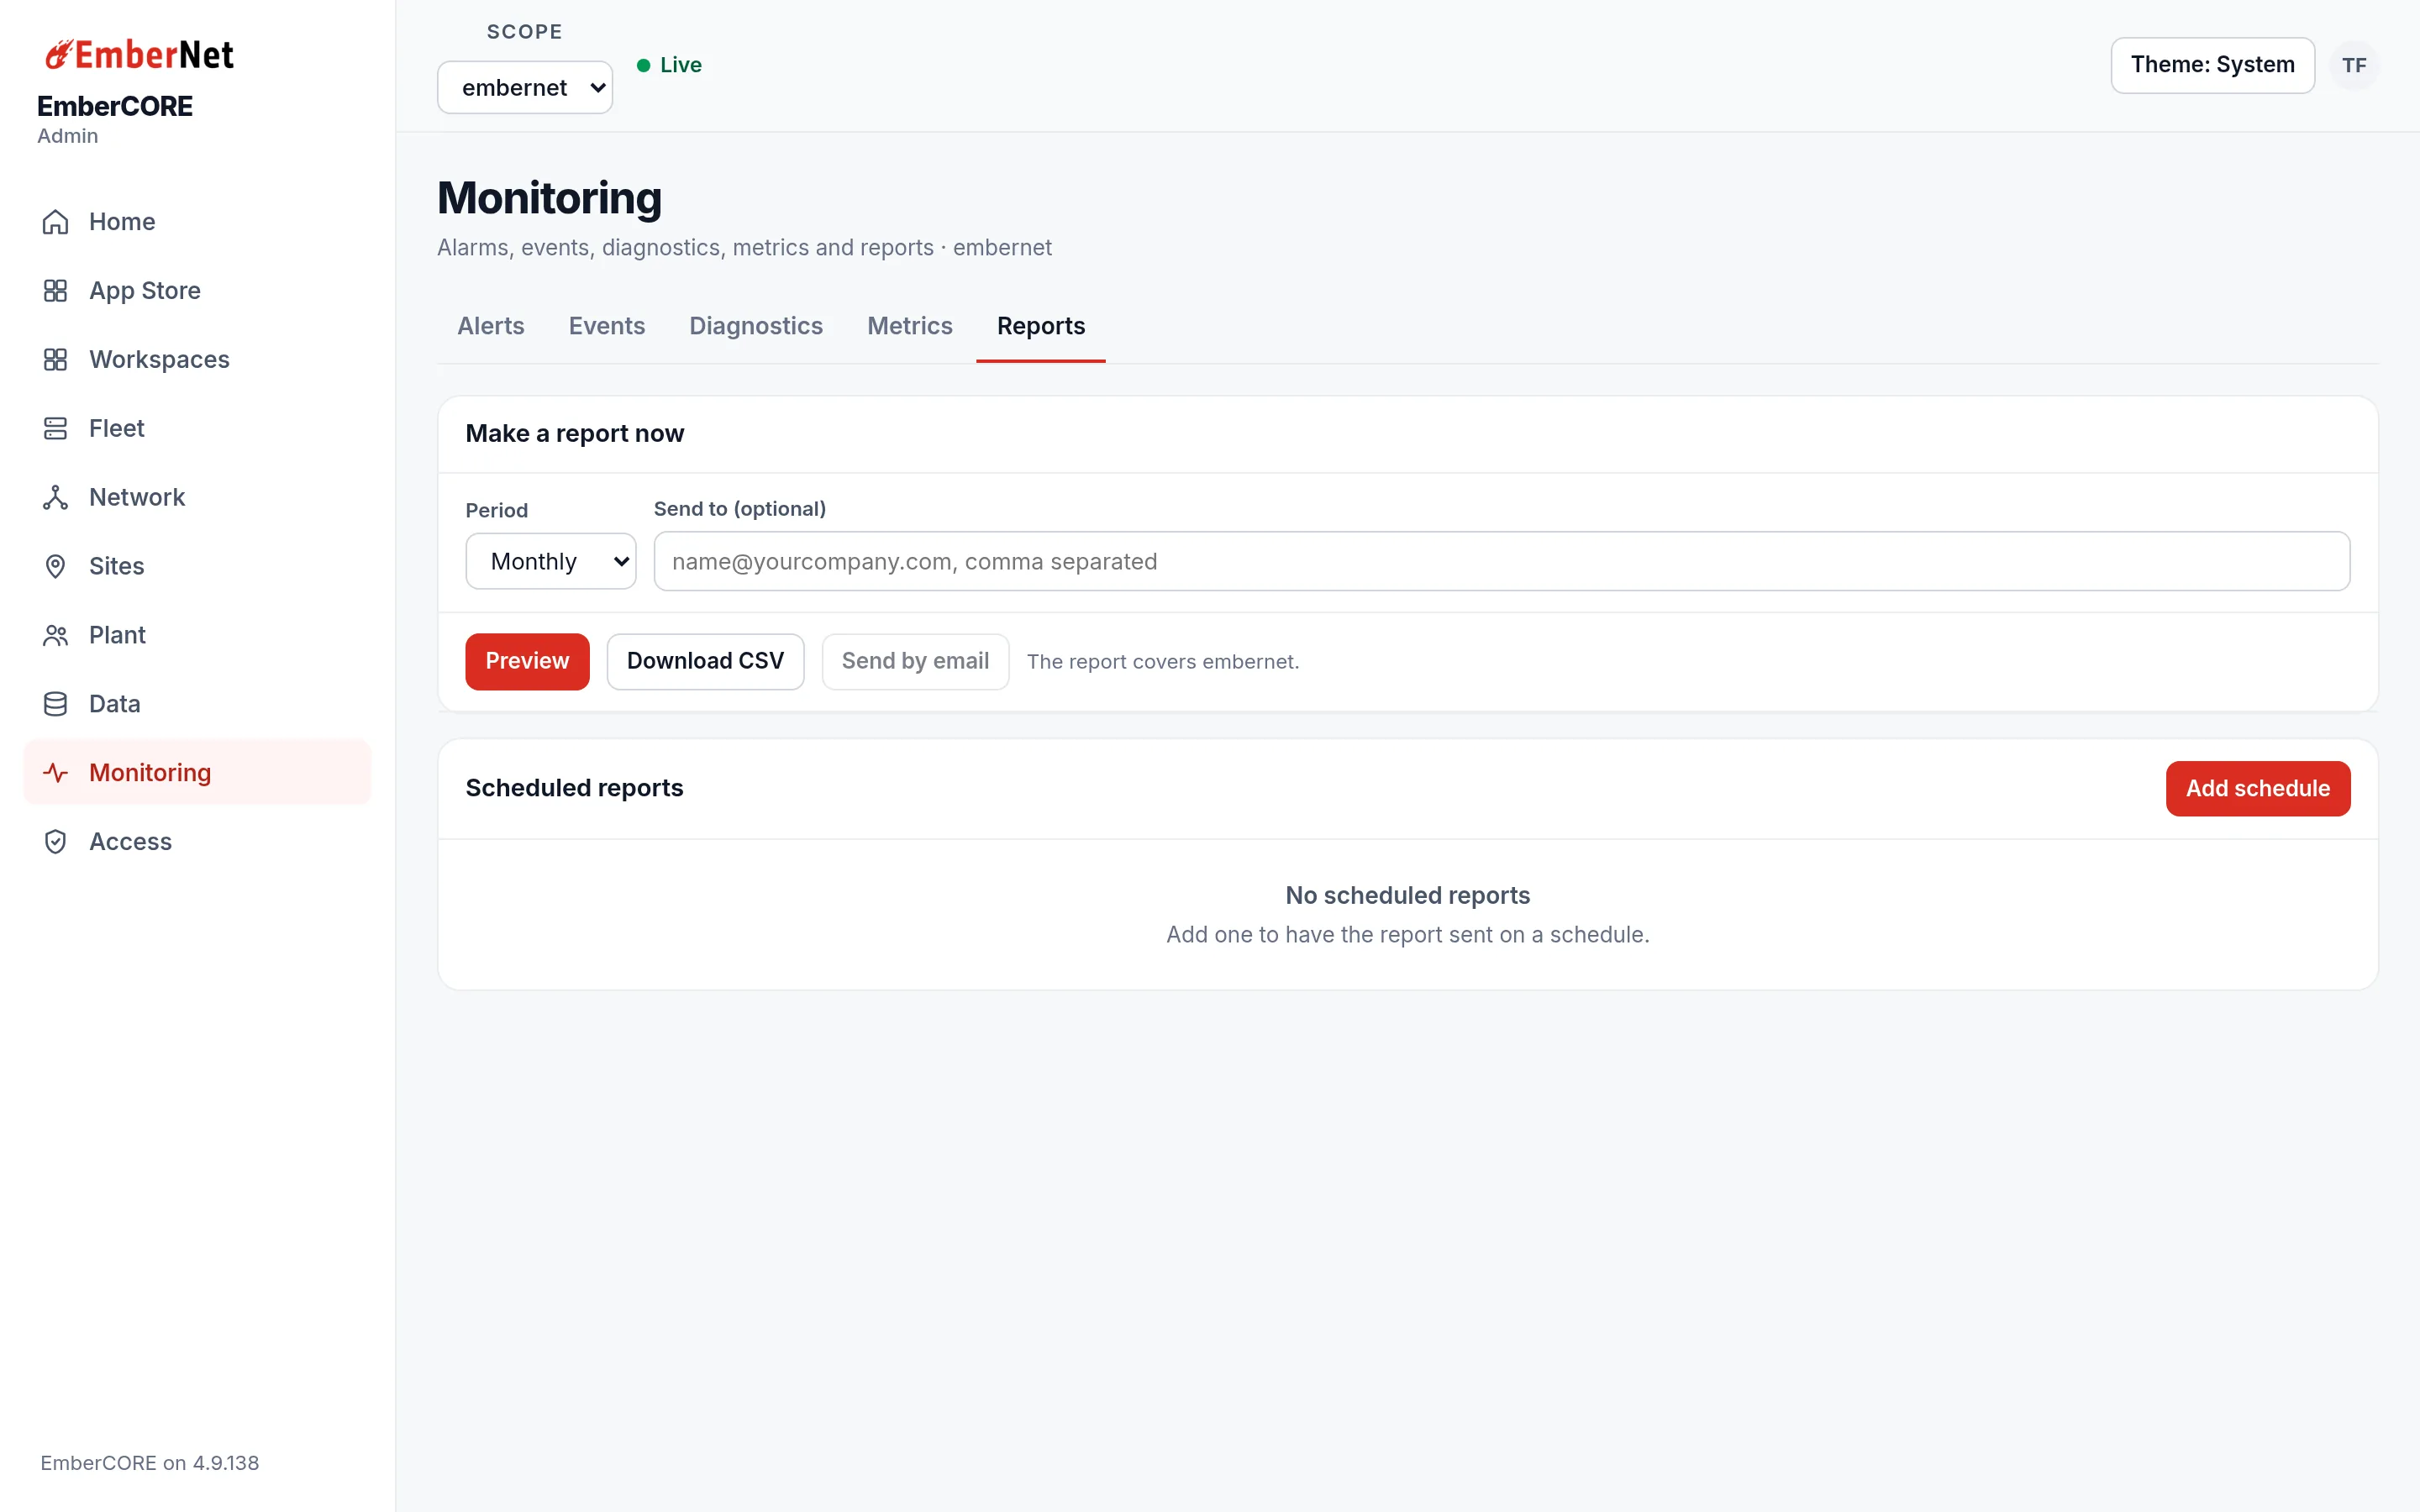
Reports turns your audit activity into a compliance report. Under Make a report now, choose the period (for example monthly) and optionally an email address, then:
- Preview opens the report on screen, with totals for events, unique users, action types, and the retention period.
- Download CSV saves the data.
- Send by email mails it to the address you entered.
Scheduled reports lists reports that send on a schedule, and Add schedule creates one.